SaaS Customer Lifetime Value Calculation Guide
SaaS Customer Lifetime Value Calculation Guide
Ollie Efez
November 30, 2025•19 min read
Customer Lifetime Value, or CLV, is a simple concept with massive implications. At its core, it's an estimate of the total revenue you can reasonably expect to earn from a single customer over the entire time they use your product.
It’s far more than just a number for your dashboard. Think of it as the ultimate health check for your SaaS business. It pits what you spend to get a customer against what they're actually worth to you in the long run.
Why Mastering CLV Is a Non-Negotiable for SaaS Growth

In a crowded market, simply knowing your CLV isn’t enough—you have to master it. It's the compass that guides your most important decisions, from marketing budgets and sales priorities to your product roadmap. When you calculate CLV, you're not just crunching numbers; you're discovering the real, long-term value of your customer base.
This insight is what separates blind spending from strategic investment. It helps you focus on the acquisition channels that bring in profitable, loyal customers and double down on retention strategies that actually move the needle.
The Elephant in the Room: Sky-High Acquisition Costs
The ever-rising cost of getting a new customer is precisely why CLV matters so much. You need to know that every dollar you spend on acquisition will eventually pay for itself, and then some.
The numbers are pretty staggering. Over the last eight years, SaaS customer acquisition costs have shot up by 222%. The average CAC for a SaaS company now sits around $702, a testament to how fierce the competition has become. This new reality makes a precise CLV calculation an absolute must-have. Companies that get it wrong can easily overspend on acquisition by up to 25%—a mistake few can afford.
CLV isn’t just about knowing what a customer is worth. It’s about deeply understanding the economics of your business and answering the most critical question: Is our growth actually sustainable?
Putting Your CLV Data to Work
A solid grasp of your CLV empowers every team to make smarter, data-driven decisions that fuel real growth. Here’s how it works in practice:
- Smarter Marketing Budgets: CLV tells you exactly how much you can afford to spend to land a new customer and still stay profitable. It defines your ideal Customer Acquisition Cost (CAC).
- Focused Sales Efforts: Your sales team can use CLV insights to identify and prioritize leads who look like your most valuable, long-term customers.
- Data-Informed Product Decisions: By segmenting CLV, you can see which features drive the most value and loyalty, helping you decide what to build next.
- Justified Customer Success: CLV proves the financial impact of reducing churn, making it easier to justify investments in retention and support.
Ultimately, mastering CLV is about building a more resilient, profitable, and enduring business. To explore this topic further, check out this excellent guide on understanding the lifetime value of a customer in SaaS.
Now, let's get into the nuts and bolts of how you can calculate it.
How to Calculate Your Foundaxstional SaaS CLV
Alright, let's roll up our sleeves and get practical. The simplest, most direct way to run a SaaS customer lifetime value calculation gives you a solid baseline for understanding your business's health. Think of it as the perfect entry point before diving into more complex models.
This foundational formula is refreshingly simple. It only needs two core metrics that you should already have at your fingertips.
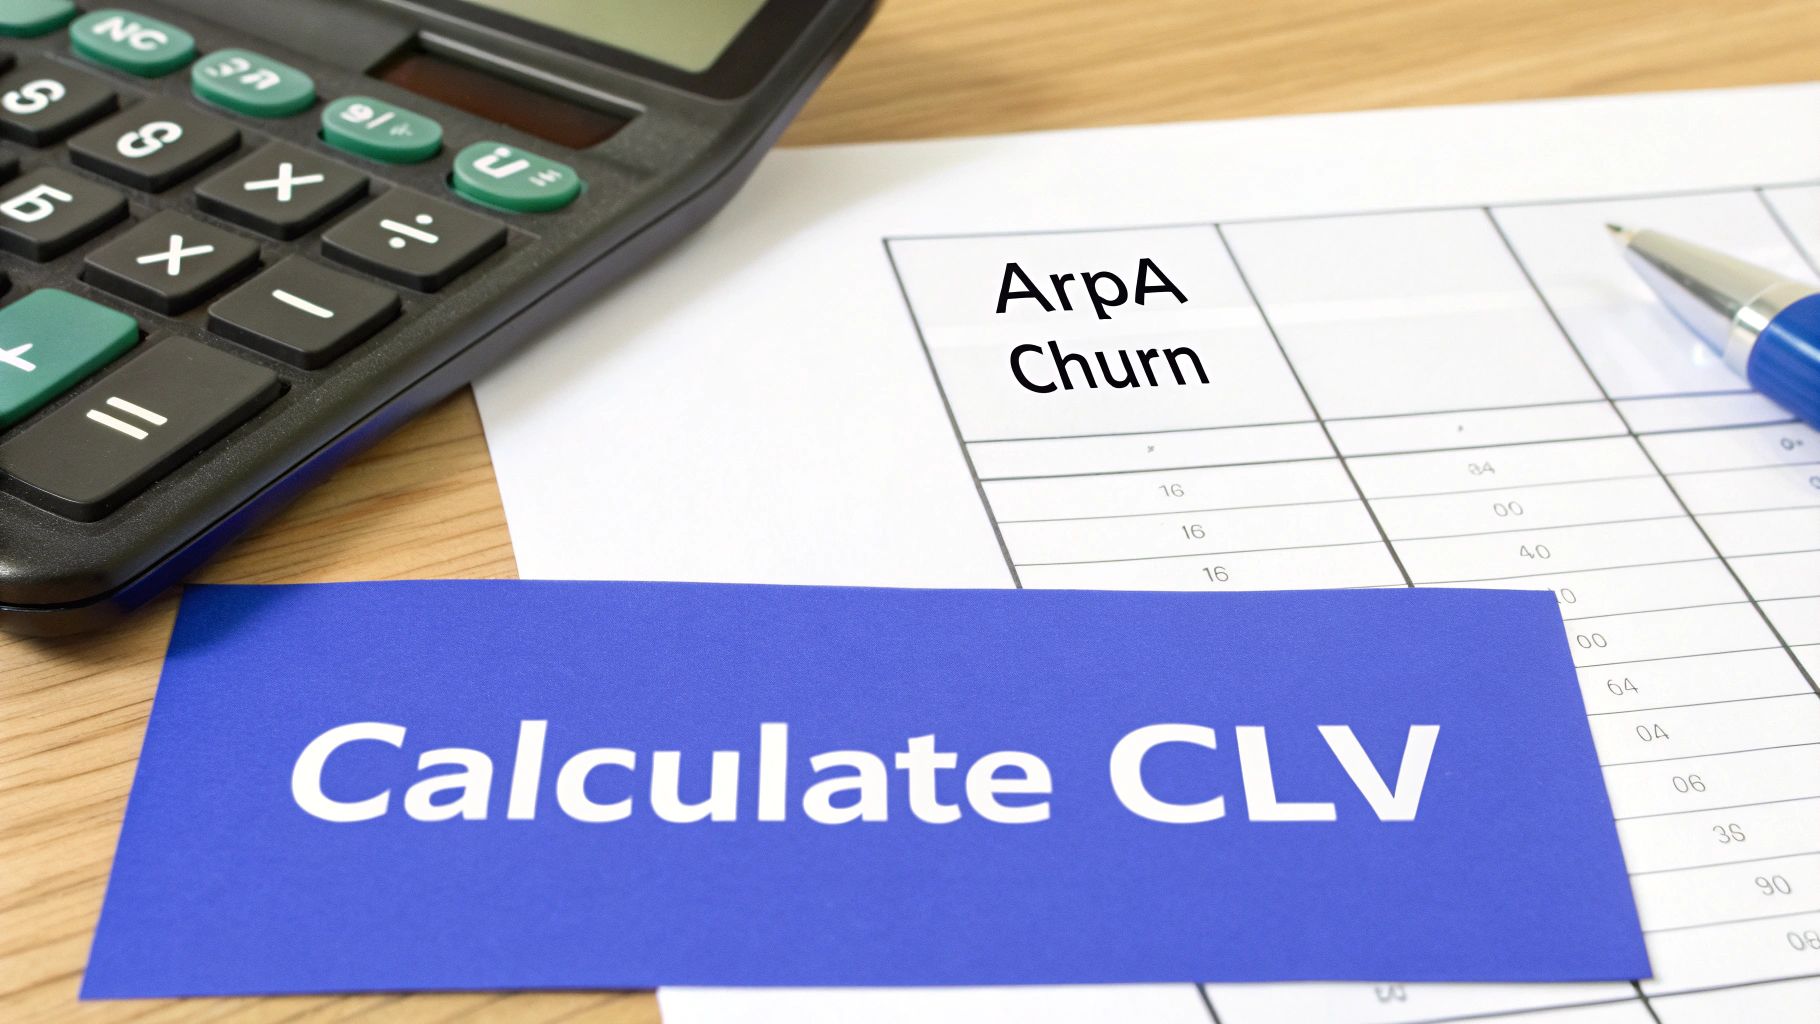
Here it is: CLV = Average Revenue Per Account (ARPA) / Customer Churn Rate
Let’s walk through each piece of that formula. By the end, you'll have a reliable, repeatable process for getting your first CLV number.
Finding Your Average Revenue Per Account (ARPA)
First up, you need your Average Revenue Per Account (ARPA). This is simply the average amount of money you make from each customer over a set period, which for SaaS is almost always a month.
To get your ARPA, just take your total Monthly Recurring Revenue (MRR) and divide it by your total number of active customers for that same month.
ARPA Formula: Total MRR / Total Number of Customers
Let's imagine you run a B2B SaaS called "ProjectFlow" that has three different subscription plans. Here’s what a typical month might look like:
- Startup Plan: 100 customers @ $50/month = $5,000 MRR
- Business Plan: 50 customers @ $150/month = $7,500 MRR
- Enterprise Plan: 10 customers @ $500/month = $5,000 MRR
Your total MRR is $17,500 and your total customer count is 160.
Now, we just plug those numbers into the formula:
$17,500 (Total MRR) / 160 (Total Customers) = $109.38 (ARPA)
For ProjectFlow, the average customer brings in $109.38 in revenue every single month.
The Link Between Customer Lifetime and Churn
The other half of the equation is your Customer Churn Rate. This is the percentage of customers who cancel their subscriptions in a given period. It's the flip side of retention and tells you, on average, how long people stick around.
The relationship is an inverse one: the lower your churn, the longer your customers stay. It's a fundamental SaaS truth.
You can actually calculate the average customer lifetime from churn with this formula:
Customer Lifetime Formula: 1 / Customer Churn Rate
So, if your monthly churn rate is 2.5% (or 0.025 in decimal form), your average customer lifetime looks like this:
1 / 0.025 = 40 months
This tells us the average customer will stay with your business for about 40 months. If you're not confident in your churn number, it's worth taking the time to get it right. You can use a dedicated tool like this SaaS churn calculator to double-check your math.
Key Takeaway: This basic CLV formula works so well because it's built on two of the most vital SaaS metrics: how much a customer pays (ARPA) and how long they stay (which is dictated by churn). Getting these two inputs right is non-negotiable.
Putting It All Together: A Full Example
We've got both pieces of the puzzle. Let's use the numbers from our fictional company, ProjectFlow, to see the whole picture come together.
Here are the inputs we figured out:
- Average Revenue Per Account (ARPA): $109.38 per month
- Customer Churn Rate: 2.5% per month (or 0.025)
Now, we plug them into the main formula:
CLV = ARPA / Customer Churn Rate
CLV = $109.38 / 0.025
ProjectFlow’s CLV = $4,375.20
There it is. On average, every new customer ProjectFlow signs up is worth $4,375.20 in total revenue over their entire relationship with the company.
This one number is a game-changer. It provides the financial context you need to make smart decisions on everything from marketing budgets and sales commissions to customer success investments. It’s the foundational metric that opens the door to much deeper strategic analysis.
Moving Beyond the Basics with Advanced CLV Models
The basic CLV formula is a great start. It gives you a single, powerful number to anchor your thinking on customer acquisition and retention. But to really start making sharp, strategic decisions, you've got to go deeper.
Think of it this way: the basic calculation gives you the big picture, but advanced models let you zoom in on the details that truly drive your business forward. They help you answer the tough questions. Which customers are actually profitable? Are our product updates making a real difference to long-term value? What can we realistically expect from this new batch of signups?
Factoring in Profitability with Margin-Adjusted CLV
Let's be honest: revenue is vanity, profit is sanity. The simple CLV formula is all about revenue, but a sustainable business runs on profit. You need to know how much cash each customer actually leaves you with after you've paid to keep the lights on. That's exactly what Margin-Adjusted CLV is for.
This model refines the basic formula by accounting for your Cost of Goods Sold (COGS). In the SaaS world, COGS usually includes any cost directly tied to delivering your service, such as:
- Hosting and server costs (like your AWS or Azure bill)
- Third-party API and software licenses that your product needs to run
- Salaries for your customer support and success teams
Once you subtract these costs, you get your gross margin—the actual profit from each subscription. The math is a simple tweak to what you already have:
Margin-Adjusted CLV = CLV Gross Margin %
Let’s go back to our "ProjectFlow" example. We calculated their basic CLV at $4,375.20. If their gross margin is a healthy 80%, the picture changes significantly:
Margin-Adjusted CLV = $4,375.20 0.80 = $3,500.16
This $3,500.16 is the number you should be building your strategy around. It’s the real profit you can expect from an average customer, which gives you a much more grounded and realistic cap for your Customer Acquisition Cost (CAC).
Uncovering Trends with Cohort Analysis
Lumping all your customers together is a classic mistake. It masks crucial trends. A customer who signed up two years ago is going to behave very differently from someone who joined last month right after you launched a game-changing new feature. This is where cohort analysis becomes your best friend.
A cohort is just a group of customers who share a common trait, usually the month or quarter they signed up. By calculating CLV for each cohort, you can see the direct impact of your business decisions over time.
For instance, say you rolled out a major feature in Q2. By comparing the CLV of your "Q2 Cohort" against the "Q1 Cohort," you can get concrete answers. Did the new feature lead to better retention? Did the Q2 group upgrade to higher-priced plans more quickly?
Cohort analysis turns CLV from a static number into a story about your business. It shows you how things are evolving and tells you if your product tweaks and marketing efforts are actually creating more valuable customers.
This method does require you to be more diligent with your data, but the feedback it gives you on your strategy is priceless. It's one of the best ways to truly understand the long-term impact of the choices you make in the saas customer lifetime value calculation.
Forecasting the Future with Predictive CLV
While looking back at historical data is useful, the smartest SaaS companies are looking forward with Predictive CLV. This approach uses past transactional and behavioral data to forecast how much a customer will be worth, often from the moment they sign up.
Instead of waiting months (or years) to see how a customer's value develops, predictive models can give you a solid estimate right away. These models can be pretty straightforward, looking at things like a customer's initial plan choice and early engagement, or they can be incredibly complex, crunching dozens of different data points.
Modern AI-powered tools have made these predictions remarkably accurate, with some companies reporting a 25% improvement in LTV forecasts. It's a huge deal. While 89% of businesses know CLV is critical, only 42% feel they can measure it well. The ones who get it right can see their profitability jump by up to 40%. If you want to dig into the details, you can see how leading companies are mastering SaaS LTV measurement with modern strategies.
The strategic edge you get from predictive CLV is massive. It allows you to:
- Spot VIPs Early: Identify customers who are likely to be high-value and roll out the red carpet to keep them happy.
- Spend Smarter: Tweak your marketing bids based on the predicted value of users coming from different channels.
- Prevent Churn: Get an early warning when a customer's predicted CLV starts to drop, giving you a chance to step in and save the account.
Moving to these advanced models—Margin-Adjusted, Cohort, and Predictive—takes a bit more work, but the payoff is a much deeper, more actionable understanding of your business. It elevates the saas customer lifetime value calculation from a simple metric to the very core of your growth engine.
To help you decide which model is right for you, here’s a quick comparison of the approaches we've covered.
Comparison of CLV Calculation Methods
Each method has its place. Start with what's manageable, but always aim to move toward a more nuanced model as your business and data capabilities grow.Using CLV to Make Smarter Business Decisions
https://www.youtube.com/embed/OXYGgvZeV1E
Figuring out your Customer Lifetime Value is a huge step, but the number itself is just a starting point. The real magic happens when you use that number to make sharper, more profitable decisions across your entire business. This is where your SaaS customer lifetime value calculation goes from being a historical metric to a strategic weapon.
The most powerful way to put CLV to work is by pairing it with its natural counterpart: Customer Acquisition Cost (CAC). This duo forms the LTV to CAC ratio, which is arguably the single most important metric for understanding the health and long-term viability of any SaaS company.
Why the 3 to 1 LTV to CAC Ratio Is the Gold Standard
You’ve probably heard people talk about the 3:1 ratio. It’s not just some random benchmark; it’s the proven sweet spot for sustainable growth. Put simply, it means for every dollar you spend to acquire a new customer, you should be getting at least three dollars back over their lifetime.
But why three? A 1:1 ratio means you’re actually losing money once you factor in the costs of running your business. A 2:1 ratio is better, but it doesn't leave much room for error or for reinvesting in growth.
A 3:1 ratio, on the other hand, tells you that you have a healthy, efficient growth engine. It confirms you’re acquiring customers profitably and have enough margin to cover all your costs, invest in making your product better, and pour more fuel on your marketing fire.
A Playbook for Strategic Decisions
Your LTV:CAC ratio shouldn't just be a number that lives on a dashboard. It should actively guide how you spend your money and what strategies you pursue. It’s the key to answering tough questions about where to allocate your resources.
Here’s how you can put it into action:
- Setting Marketing Budgets: If your LTV is $3,000, the 3:1 rule suggests your target CAC should be around $1,000. This gives your marketing team a clear, data-backed budget to work with for every new customer they bring in.
- Defining Affiliate Commission Caps: Running an affiliate program? With a $3,000 LTV, offering a $500 commission is perfectly sustainable because it fits comfortably within your $1,000 target CAC.
- Determining Payback Periods: Your payback period is the time it takes to earn back what you spent to acquire a customer. A healthy SaaS business aims to get that money back in under 12 months. Your LTV helps you understand if a longer payback period is even remotely sustainable.
This decision tree illustrates how you can move from a basic CLV number to more sophisticated models that drive these kinds of strategic choices.
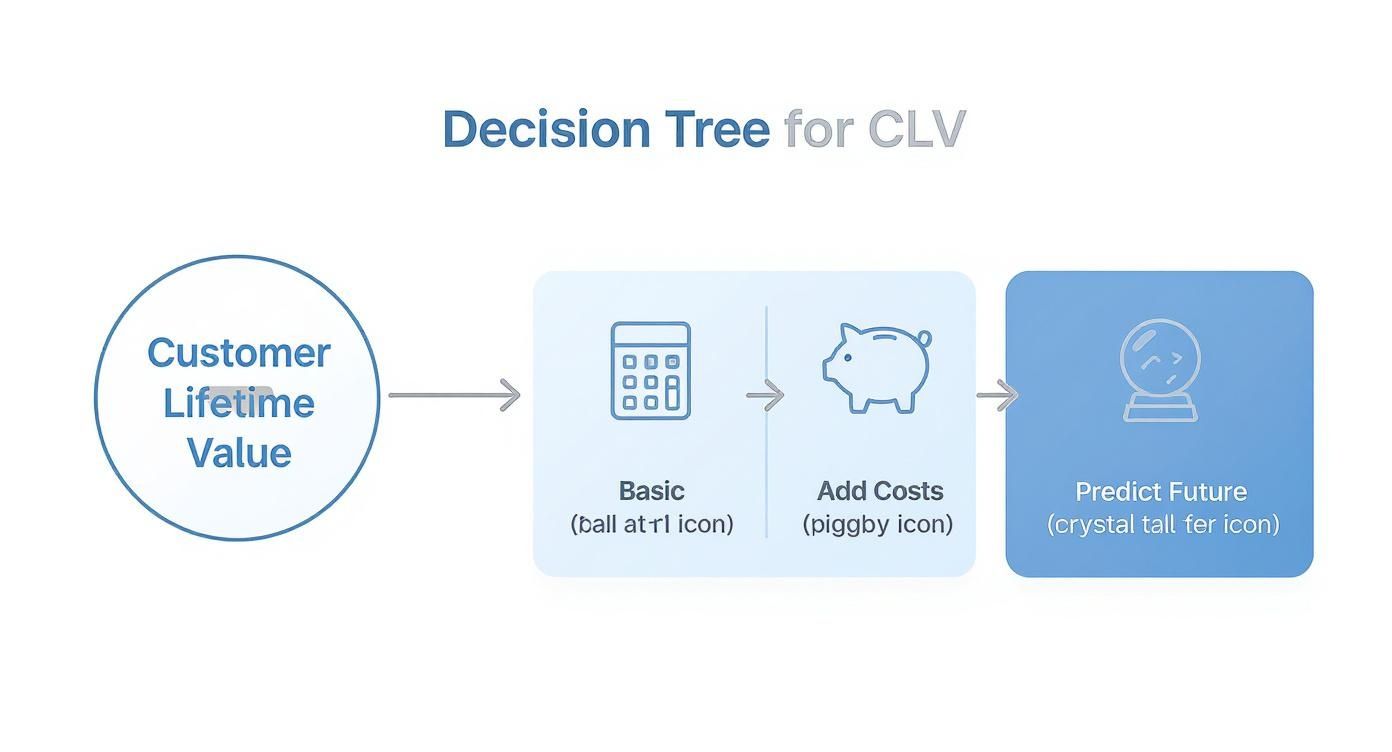
As you can see, the more data you layer in—like gross margin and predictive analytics—the more powerful your CLV insights become.
Real-World Scenario: Choosing Your Growth Engine
Let's imagine a SaaS company called "ConnectSphere." They've calculated their LTV to be $2,400, which gives them a target CAC of $800 to maintain their 3:1 ratio. Now, they need to decide where to invest their marketing budget.
- Option A: Paid Ads: Their Google Ads campaigns are currently bringing in customers for $750 each. This gives them a 3.2:1 ratio—profitable and scalable, but they've noticed their cost-per-click is creeping up.
- Option B: Content Marketing: Their blog and SEO efforts attract customers at an estimated CAC of $400 (after factoring in writer salaries and tools). That's an amazing 6:1 ratio, but it's a much slower burn to scale up.
Using their LTV:CAC ratio, ConnectSphere can make a smart, balanced decision. They might decide to allocate 70% of their budget to the predictable results from paid ads to hit their immediate growth goals. The other 30% can be invested in the more profitable, long-term engine of content marketing. To get a better handle on the inputs, check out our guide on the customer acquisition cost calculation.
A huge part of protecting your LTV is keeping the customers you already have. By using your data for predictive churn modelling, you can spot at-risk customers and step in before they leave, directly protecting and growing your overall LTV.
At the end of the day, CLV gives you the financial clarity to stop guessing. You can start making strategic investments that ensure your growth isn't just fast, but also profitable and built to last.
Common CLV Calculation Pitfalls to Avoid

Running a SaaS customer lifetime value calculation is a huge step in the right direction. But here’s the thing: the formulas are only as sharp as the data and logic you feed them. It's shockingly easy to make small missteps that lead to big, flawed conclusions, pushing you to overspend on marketing or completely misread your company's health.
Let's walk through the most common traps I've seen teams fall into. Getting this right isn’t just about being a numbers geek; it’s about building a reliable compass to guide your most critical growth decisions.
Mistaking Revenue for Profit
This is probably the most frequent—and dangerous—mistake out there. If you're using top-line revenue instead of gross margin in your CLV calculations, you're looking at a vanity metric. Your CLV might look incredible on a spreadsheet, but if it ignores the cost of actually delivering your service, you're flying blind.
Revenue doesn't pay the bills; profit does. Your CLV needs to reflect the real cash a customer brings in after you’ve covered the essentials.
The fix is to always use a margin-adjusted formula. Start by figuring out your Cost of Goods Sold (COGS). For a SaaS business, this usually includes:
- Hosting and Infrastructure: Your bills from cloud providers like AWS or Azure.
- Third-Party Software Fees: Costs for any essential tools and APIs baked into your product.
- Customer Support Salaries: The slice of your support team's payroll dedicated to helping existing customers.
Once you have your gross margin, your CLV calculation will show you what a customer is really worth. That number gives you a solid, realistic ceiling for your customer acquisition spending.
Treating All Customers the Same
A single, company-wide CLV is a blunt instrument. It averages out your high-value enterprise clients with your small, self-serve users, giving you a number that doesn't actually represent anyone. This approach completely masks the insights that could transform your strategy.
Think about it. An enterprise customer paying $1,000/month who sticks around for five years has a wildly different lifetime value than a startup on a $50/month plan that churns after six months. Lumping them together is just bad math leading to bad decisions.
The real magic of CLV happens when you start segmenting. Instead of one number, aim for several. That’s where you’ll find the actionable intelligence you need to grow smarter.
Start by breaking down your CLV by:
- Pricing Tiers: What's the long-term value of a Basic vs. Pro vs. Enterprise customer?
- Acquisition Channel: Do customers from organic search stick around longer than those from paid ads?
- Company Size: How does the CLV of an SMB compare to that of an enterprise client?
This segmented view lets you pour resources into acquiring and keeping your absolute best customers.
Using Stale and Outdated Data
The final pitfall is treating CLV as a "set it and forget it" metric. The SaaS world moves fast. A CLV you calculated six—or even three—months ago could already be irrelevant. Pricing changes, churn rates fluctuate, and new features get adopted.
Relying on old data is like navigating with a map from last year. You'll end up making decisions based on where your business used to be, not where it is today.
To keep this from happening, get into a regular rhythm of updating your numbers. For most SaaS companies, recalculating CLV quarterly is a solid baseline. If you have the bandwidth, doing it monthly is even better. This discipline ensures your strategic decisions—from setting marketing budgets to adjusting LTV:CAC targets—are always grounded in the most current, accurate picture of your business. It turns CLV from a static snapshot into a living metric that guides your growth.
SaaS CLV FAQs
Even with the right formulas, you'll probably have questions when you start calculating and using your SaaS CLV. It happens to everyone. Let's walk through some of the most common ones I hear from founders and marketers.
How Often Should We Calculate CLV?
Ideally, you should be looking at CLV monthly. Things change fast in SaaS. A quarterly check-in is the absolute minimum, but waiting that long means you could miss a critical trend.
When you track it monthly, you can spot problems early. Did the CLV for last month's new signups suddenly drop? That could be a red flag pointing to a botched feature rollout or a confusing onboarding flow. Calculating CLV regularly turns it from a historical report into a real-time health metric for your business.
The real answer to "how often" isn't about a set schedule. It's about matching your operational pace. If you're tweaking marketing spend every week, you need a CLV model that's just as fresh.
What’s a Good LTV to CAC Ratio for an Early-Stage SaaS?
Everyone chases the golden 3:1 ratio—meaning for every dollar you spend to acquire a customer, you get three dollars back over their lifetime. But for a startup, that's often a future goal, not a starting point.
It's not uncommon to see early-stage companies running at a 1:1 or 2:1 ratio. This is perfectly fine if you're investing in growth and have a solid plan to improve it. The key is to show you're tracking your unit economics from day one and have a clear roadmap to hitting that 3:1 benchmark as you scale. Investors will absolutely be looking for that upward trend.
How Can I Actually Improve Our Company's CLV?
Improving CLV isn’t some abstract goal; it boils down to two very concrete actions: get customers to pay you more and get them to stick around longer.
- Boost Revenue: This is all about upselling and cross-selling. Encourage customers to move up to higher-tier plans or sell them add-on features that solve another one of their problems. Every upgrade directly bumps up their Average Revenue Per Account (ARPA).
- Extend Customer Lifetime: This comes down to the customer experience. Nail your onboarding process, provide proactive support that wows them, and consistently ship product updates that make their lives easier. Even tiny improvements in your churn rate can have an outsized impact on CLV over time.
Do Discounts Mess Up My CLV Calculation?
Absolutely. Discounts have a massive and direct impact. While a 20% off coupon might close a deal today, it permanently lowers that customer's lifetime value by reducing their ARPA from the very beginning. It also sets a dangerous precedent, anchoring their price expectations low.
When you run your numbers, you have to use the actual revenue you collected after all discounts are applied. Otherwise, your CLV will be inflated and misleading. More often than not, it's better to win customers at full price by proving your value, not by slashing your prices. For a deeper dive into the core concepts, you can explore more about the essentials of lifetime value and how it shapes business strategy.
Ready to manage and scale a high-performing affiliate program without the complexity? LinkJolt provides all the tools you need, from automated payouts to real-time analytics, helping you turn partnerships into a powerful growth engine. https://linkjolt.io
Watch Demo (2 min)
Trusted by 300+ SaaS companies
Start Your Affiliate Program Today
Get 30% off your first 3 months with code LINKJOLT30
✓ 3-day free trial
✓ Cancel anytime